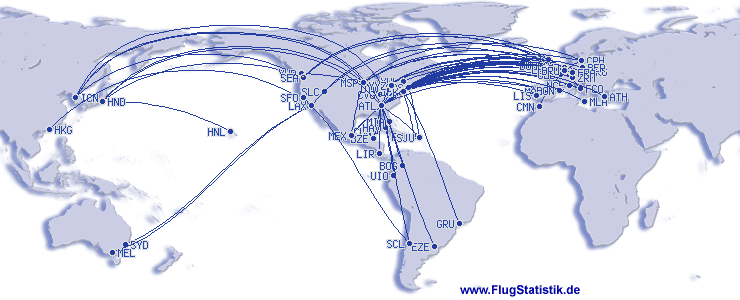
Top 10 Aeroportos
| # | Aeroporto | Qtd. | % |
|---|
| 1 |
ATL |
Atlanta |
343 |
18,0 % |
| 2 |
MSP |
Minneapolis |
171 |
9,0 % |
| 3 |
SLC |
Salt Lake City |
113 |
5,9 % |
| 4 |
DTW |
Detroit |
89 |
4,7 % |
| 5 |
JFK |
New York |
82 |
4,3 % |
| 6 |
BOS |
Boston |
67 |
3,5 % |
| 7 |
SEA |
Seattle |
61 |
3,2 % |
| 8 |
LAX |
Los Angeles |
60 |
3,1 % |
| 9 |
LGA |
New York |
51 |
2,7 % |
| 10 |
MCO |
Orlando |
40 |
2,1 % |
|
|
Top 10 Companhias
| # | Companhia | Qtd. | % |
|---|
| 1 |
Delta Air Lines |
953 |
100,0 % |
|
|
Top 10 Aeronaves
| # | Modelo de Avião | Qtd. | % |
|---|
| 1 |
Airbus A320 Familie |
241 |
25,3 % |
| 2 |
Boeing 737 |
159 |
16,7 % |
| 3 |
Airbus A220 |
81 |
8,5 % |
| 4 |
Canadair |
61 |
6,4 % |
| 5 |
Boeing 757 |
61 |
6,4 % |
| 6 |
Airbus A330 |
58 |
6,1 % |
| 7 |
Embraer |
48 |
5,0 % |
| 8 |
Boeing 767 |
40 |
4,2 % |
| 9 |
Boeing 717 |
38 |
4,0 % |
| 10 |
Airbus A350 |
27 |
2,8 % |
|
Top 10 Rotas
| # | Rota | Qtd. | % |
|---|
| 1 |
FLL-ATL |
7 |
0,7 % |
| 2 |
MSP-ATL |
7 |
0,7 % |
| 3 |
SLC-MCO |
7 |
0,7 % |
| 4 |
MCO-SLC |
7 |
0,7 % |
| 5 |
ATL-DFW |
7 |
0,7 % |
| 6 |
MSY-ATL |
7 |
0,7 % |
| 7 |
PHL-ATL |
6 |
0,6 % |
| 8 |
ATL-LAX |
6 |
0,6 % |
| 9 |
MSP-BOS |
6 |
0,6 % |
| 10 |
BOS-MSP |
6 |
0,6 % |
|
|
Dados Adicionais
| Total de Aeroportos | 159 |
|---|
| Total de Companhias | 1 |
|---|
| Total de Modelos de Avião | 149 |
|---|
| Total de Aviões | 411 |
|---|
| Total de Rotas | 576 |
|---|
| Total de Países | 43 |
|---|
|