Top Ten Flughäfen
| # | Flughafen | Anzahl | Prozent |
|---|
| 1 |
DXB |
Dubai |
65 |
15,4 % |
| 2 |
MUC |
München |
50 |
11,8 % |
| 3 |
SIN |
Singapur |
40 |
9,5 % |
| 4 |
SYD |
Sydney |
26 |
6,2 % |
| 5 |
LHR |
London |
21 |
5,0 % |
| 6 |
NRT |
Tokio |
20 |
4,7 % |
| 7 |
BKK |
Bangkok |
17 |
4,0 % |
| 8 |
LAX |
Los Angeles |
15 |
3,6 % |
| 9 |
FRA |
Frankfurt |
14 |
3,3 % |
| 10 |
DEN |
Denver |
13 |
3,1 % |
|
|
Top Ten Airlines
| # | Airline | Anzahl | Prozent |
|---|
| 1 |
Emirates |
50 |
23,7 % |
| 2 |
Lufthansa |
43 |
20,4 % |
| 3 |
Singapore Airlines |
30 |
14,2 % |
| 4 |
Emirates Airlines |
26 |
12,3 % |
| 5 |
Qantas Airways |
19 |
9,0 % |
| 6 |
Etihad Airways |
12 |
5,7 % |
| 7 |
Qatar Airways |
8 |
3,8 % |
| 8 |
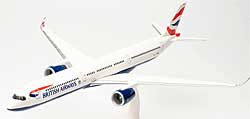
British Airways |
8 |
3,8 % |
| 9 |
Asiana Airlines |
4 |
1,9 % |
| 10 |
Korean Air |
3 |
1,4 % |
|
|
Top Ten Flugzeugtypen
| # | Flugzeugtyp | Anzahl | Prozent |
|---|
| 1 |
Airbus 380 |
108 |
51,2 % |
| 2 |
Airbus A380-800 |
27 |
12,8 % |
| 3 |
Airbus 380-800 |
22 |
10,4 % |
| 4 |
A380-800 |
12 |
5,7 % |
| 5 |
Airbus A380 |
7 |
3,3 % |
| 6 |
A380 |
6 |
2,8 % |
| 7 |
Airbus A380 - 800 |
5 |
2,4 % |
| 8 |
Airbus 380-861 |
4 |
1,9 % |
| 9 |
Airbus A380-842 |
3 |
1,4 % |
| 10 |
A388 |
3 |
1,4 % |
|
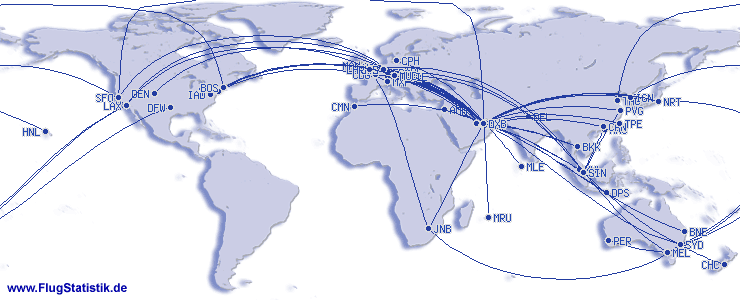
Top Ten Flugrouten
| # | Flugroute | Anzahl | Prozent |
|---|
| 1 |
SIN-SYD |
8 |
3,8 % |
| 2 |
BKK-DXB |
8 |
3,8 % |
| 3 |
DEN-MUC |
8 |
3,8 % |
| 4 |
SYD-SIN |
7 |
3,3 % |
| 5 |
IAD-MUC |
6 |
2,8 % |
| 6 |
DUS-DXB |
6 |
2,8 % |
| 7 |
MUC-BOS |
6 |
2,8 % |
| 8 |
SIN-FRA |
6 |
2,8 % |
| 9 |
SIN-LHR |
5 |
2,4 % |
| 10 |
MUC-IAD |
5 |
2,4 % |
|
|
Zusatzinfos
| unterschiedliche Flughäfen | 47 |
|---|
| unterschiedliche Airlines | 13 |
|---|
| unterschiedliche Flugzeugtypen | 20 |
|---|
| unterschiedliche Flugzeuge | 99 |
|---|
| unterschiedliche Flugrouten | 98 |
|---|
| unterschiedliche Länder | 38 |
|---|
|