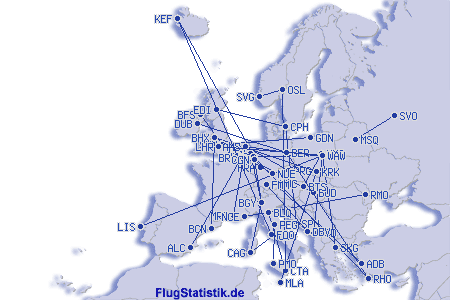
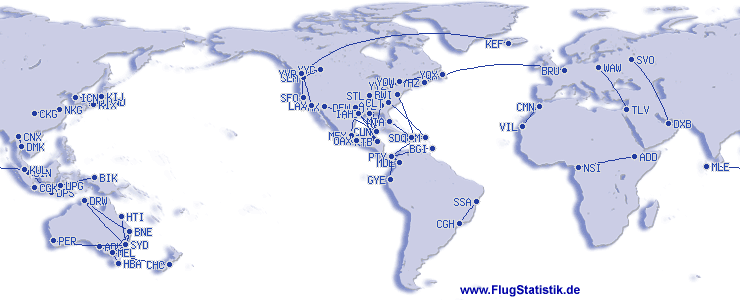
Top 10 Aeroportos
| # | Aeroporto | Qtd. | % |
|---|
| 1 |
DEN |
Denver |
12 |
3,6 % |
| 2 |
ORD |
Chicago |
12 |
3,6 % |
| 3 |
SFO |
San Francisco |
10 |
3,0 % |
| 4 |
SAN |
San Diego |
8 |
2,4 % |
| 5 |
SEA |
Seattle |
8 |
2,4 % |
| 6 |
LAS |
Las Vegas |
7 |
2,1 % |
| 7 |
SYD |
Sydney |
7 |
2,1 % |
| 8 |
MDW |
Chicago |
6 |
1,8 % |
| 9 |
IAD |
Washington |
6 |
1,8 % |
| 10 |
WAW |
Warschau |
6 |
1,8 % |
|
|
Top 10 Companhias
| # | Companhia | Qtd. | % |
|---|
| 1 |
United Airlines |
23 |
13,9 % |
| 2 |
Southwest Airlines |
22 |
13,3 % |
| 3 |
Ryanair |
17 |
10,2 % |
| 4 |
Alaska Airlines |
16 |
9,6 % |
| 5 |
American Airlines |
8 |
4,8 % |
| 6 |
Virgin Australia |
7 |
4,2 % |
| 7 |
LOT Polish Airlines |
5 |
3,0 % |
| 8 |
Qantas Airways |
4 |
2,4 % |
| 9 |
KLM Royal Dutch Airlines |
4 |
2,4 % |
| 10 |
Southwest |
4 |
2,4 % |
|
|
Top 10 Aeronaves
| # | Modelo de Avião | Qtd. | % |
|---|
| 1 |
Boeing 737 |
72 |
43,4 % |
| 2 |
Boeing 737-800 |
28 |
16,9 % |
| 3 |
Boeing 737-700 |
10 |
6,0 % |
| 4 |
Boeing 737-900 |
9 |
5,4 % |
| 5 |
737-800 |
6 |
3,6 % |
| 6 |
Boeing 737 Max 8 |
5 |
3,0 % |
| 7 |
737-700 |
3 |
1,8 % |
| 8 |
73G |
2 |
1,2 % |
| 9 |
Boeing 737-8 MAX |
2 |
1,2 % |
| 10 |
B737-800 |
2 |
1,2 % |
|
Top 10 Rotas
| # | Rota | Qtd. | % |
|---|
| 1 |
IAD-ORD |
3 |
1,8 % |
| 2 |
DEN-PHL |
2 |
1,2 % |
| 3 |
DRW-SYD |
2 |
1,2 % |
| 4 |
SYD-MEL |
2 |
1,2 % |
| 5 |
GRR-MDW |
2 |
1,2 % |
| 6 |
SAN-DFW |
2 |
1,2 % |
| 7 |
KUL-MLE |
2 |
1,2 % |
| 8 |
MSQ-SVO |
2 |
1,2 % |
| 9 |
OSL-CTA |
1 |
0,6 % |
| 10 |
DAL-SAN |
1 |
0,6 % |
|
|
Dados Adicionais
| Total de Aeroportos | 154 |
|---|
| Total de Companhias | 43 |
|---|
| Total de Modelos de Avião | 36 |
|---|
| Total de Aviões | 70 |
|---|
| Total de Rotas | 157 |
|---|
| Total de Países | 63 |
|---|
|