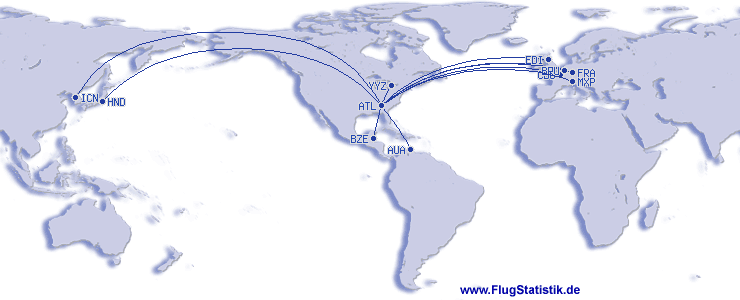
Top 10 Aeroportos
| # | Aeroporto | Qtd. | % |
|---|
| 1 |
ATL |
Atlanta |
115 |
50,0 % |
| 2 |
MSP |
Minneapolis |
6 |
2,6 % |
| 3 |
JAX |
Jacksonville |
6 |
2,6 % |
| 4 |
SFO |
San Francisco |
5 |
2,2 % |
| 5 |
LAS |
Las Vegas |
4 |
1,7 % |
| 6 |
PBI |
West Palm Beach |
4 |
1,7 % |
| 7 |
MSY |
New Orleans |
4 |
1,7 % |
| 8 |
AUS |
Austin |
4 |
1,7 % |
| 9 |
PWM |
Portland |
3 |
1,3 % |
| 10 |
LGA |
New York |
3 |
1,3 % |
|
|
Top 10 Companhias
| # | Companhia | Qtd. | % |
|---|
| 1 |
Delta Air Lines |
86 |
74,8 % |
| 2 |
Delta |
7 |
6,1 % |
| 3 |
Delta Airlines |
6 |
5,2 % |
| 4 |
United Airlines |
1 |
0,9 % |
| 5 |
Air France |
1 |
0,9 % |
| 6 |
Alaska Airlines |
1 |
0,9 % |
| 7 |
Southwest |
1 |
0,9 % |
|
|
Top 10 Aeronaves
| # | Modelo de Avião | Qtd. | % |
|---|
| 1 |
Airbus A320 Familie |
44 |
38,3 % |
| 2 |
Boeing 737 |
24 |
20,9 % |
| 3 |
Boeing 757 |
10 |
8,7 % |
| 4 |
Boeing 717 |
8 |
7,0 % |
| 5 |
Airbus A330 |
3 |
2,6 % |
| 6 |
Airbus A220 |
2 |
1,7 % |
| 7 |
Boeing 767 |
2 |
1,7 % |
| 8 |
Canadair |
2 |
1,7 % |
| 9 |
Airbus A350 |
1 |
0,9 % |
| 10 |
Boeing 777 |
1 |
0,9 % |
|
Top 10 Rotas
| # | Rota | Qtd. | % |
|---|
| 1 |
MSP-ATL |
4 |
3,5 % |
| 2 |
SFO-ATL |
3 |
2,6 % |
| 3 |
JAX-ATL |
3 |
2,6 % |
| 4 |
ATL-JAX |
3 |
2,6 % |
| 5 |
ATL-MKE |
3 |
2,6 % |
| 6 |
ATL-MSP |
2 |
1,7 % |
| 7 |
ATL-JFK |
2 |
1,7 % |
| 8 |
ATL-FRA |
2 |
1,7 % |
| 9 |
ATL-HSV |
2 |
1,7 % |
| 10 |
ATL-PBI |
2 |
1,7 % |
|
|
Dados Adicionais
| Total de Aeroportos | 63 |
|---|
| Total de Companhias | 7 |
|---|
| Total de Modelos de Avião | 43 |
|---|
| Total de Aviões | 62 |
|---|
| Total de Rotas | 85 |
|---|
| Total de Países | 12 |
|---|
|